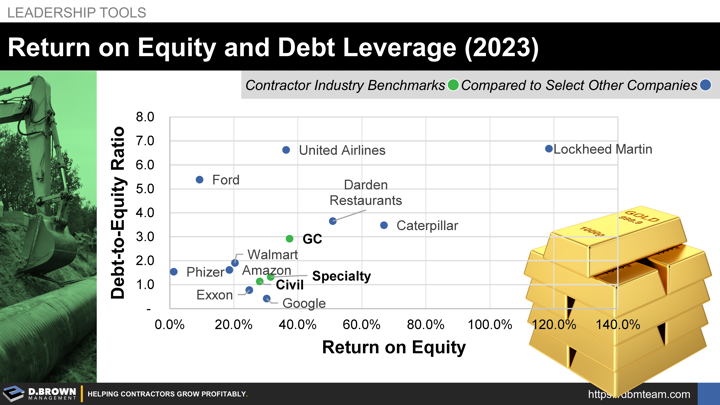
We recently conducted this exercise for fun to compare construction contractor benchmarks against other types of businesses to assess risks and returns. This is a simple comparison focusing on two financial metrics: Return-on-Equity (Operating Profits / Total Equity) and Debt-to-Equity (Total Liabilities / Total Equity).
Consider the true risk of each business in the comparison. Is construction contracting more or less risky than oil & gas? Retail? Restaurants? Manufacturing?
On average, construction contractors achieve a Return-on-Equity of 30%, with General Building Contractors averaging slightly higher at 40% due to the additional leverage of subcontracted work. Keep in mind that these are averages, meaning some contractors are losing money at one end of the bell curve, while others are achieving double the returns shown above at the other end.
Where would your business place on this matrix over the last three years?
Note that you have higher leverage on some businesses due to the high capital investments required for manufacturing (Ford / CAT), while others have been through some re-engineering processes that included increasing debt leverage, like Darden Restaurants. Others, like Google, are holding on to cash to fund future growth, which lowers their returns when only looking at these metrics but keeps their market valuation high because shareholders are expecting that cash to be put to use for both organic and acquisition-based growth.
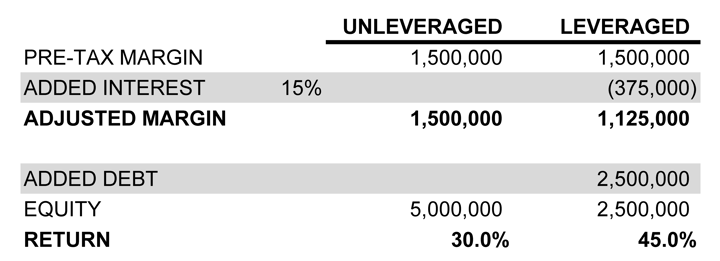
Remember that while you can use debt to increase Return-on-Equity, as shown in the example below, it can also hinder long-term resiliency.
Debt can be an amazing partner in good times but quickly turns into a relentless enemy during bad times.
You probably didn't get into The Business of Building because you loved finance. Don't hesitate to contact us to discuss your specific situation, including how to best align your capital and talent for the best returns.
Learn a little more with:


