Find your own sources of the data. In doing this, you will often see conflicts in the data from different sources and that allows you to understand what the accuracy of any model may be.
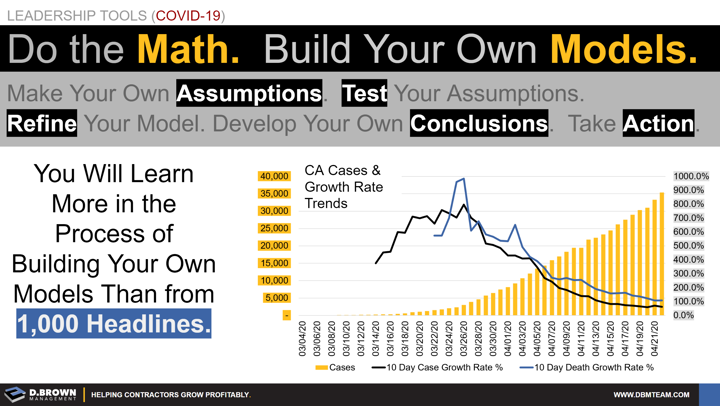
Remember that averages aren't necessarily valuable. For example, the chart shown is for the whole state of California. If your business is in Texas or Arizona, then this only makes sense to use it comparatively. Even if your business is in California, it is important to model the local areas where you are working.
Use your models and the news in concert with each other. You will quickly see which news sources truly add valuable insight, which ones just regurgitate information, and which ones are just plain wrong.
Remember that while people go to great lengths to hide illiteracy and develop capabilities to overcome it, we live in a time when many people actually brag about their inability to do math or Innumeracy, as John Paulos calls it. Many of them gravitate toward journalism. This is just a fact. Look for sources of information that are good at investigation, math, and critical thinking without dramatization.
Use the scientific method to create your own assumptions about what your model is predicting and test them. Refine your model - it's a continuous improvement process like anything else.
The more you practice this, the better your situational awareness becomes. Add dimensions to your models over time, just like you do on a project. This is a capability that can be developed.
Models like this apply to projects in preconstruction, business management, succession planning, and life the same way they do to dealing with COVID-19.
How much time do you spend developing your own models of things as a mechanism to learn?
Learning Resources


