As the leader of a contracting business, you must be constantly focused on the basic scoreboard metrics of customer satisfaction, profitability, and cash flow.
Let’s dive into something simple like profitability and quickly talk about the “benchmark averages.”
- Benchmark reports such from various sources including Moss Adams and CFMA are valuable and always worth reading.
- There are lots of different ways to account for expenses. Look at higher level measures, such as net profit before taxes.
- Realize that there are often differences in how pretax operating net profit is shows up for C-Corps as compared to pass-through entities like S-Corps and LLCs. This is typically due to it being more tax efficient for owners to take what would be bonuses out as distributions which don't show up on the income statement - only on the balance sheet. The majority of contractors are pass-through entities but depending on who responds to the surveys, 15-25% are C-Corps and that will skew the averages some. Additionally, items like accelerated depreciation can dramatically skew pretax profitability. Things like this have nothing to do with measuring actual operational execution so know what you are looking at, and the limits of what you are looking at.
- Realize that these benchmark reports are not the same as a standard index like the S&P 500 where they are including very specific companies over time so you can truly see trends. These benchmarks are based on who voluntarily responds so the trends are not perfectly consistent.
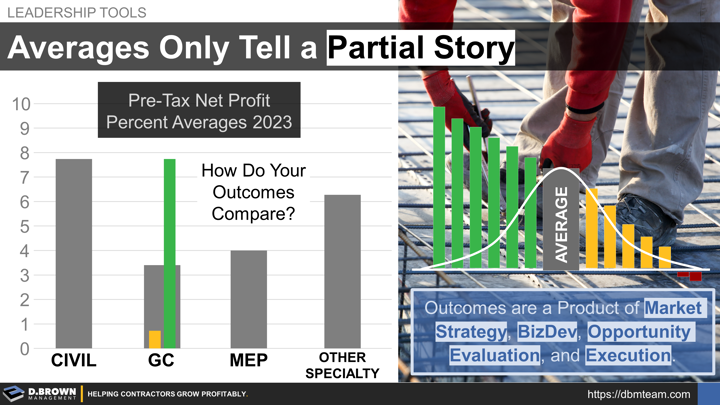
- MOST IMPORATANT - Realize that average means just that. If the average is 3%, then for every contractor who reported a 1% year, there was one that reported a 5% year. For every contractor who reported a break-even year, there was one that reported a 6% year.
- These will be distributed across a bell curve, and you want to be on the high-side of this bell curve.
A contractor’s bottom-line starts at the top-line and the work they choose to take on. This includes how much gross margin is in the project and the risk of achieving that gross margin. Consider that benchmarks are just averages and that there are many contractors operating consistently at 2X industry benchmarks while others are operating at half that.
Your outcomes are largely a product of:
- Your market strategy
- Your business development capabilities
- Your opportunity evaluation
- Your operational execution
Questions for self-evaluation:
- Look back over the last few years. What has your performance looked like as compared to benchmarks?
- How would you rank each of the four areas above (strategy, bizdev, opportunity evaluation, execution) on a scale of 0-10 and what is the primary reason for your answer about each? Please include any quantification or anecdotal stories to help describe your answer.
- Using the basic math of prioritization, what is the #1 thing that the business can do over the next year that will have the biggest positive impact on the bottom-line outcomes?

